Menlo Park Home Prices by Neighborhood in 2026
August 27, 2026
August 27, 2026
Pull up Redfin's Menlo Park page this week and you'll see a median sale price of $3.3 million, up 14.5 percent from a year ago. Open a second tab to Zillow and the number reads $2,549,093, down 6.7 percent over the same stretch. A third tab, this one pulling from PropertyShark's county-record data, puts the first-quarter 2026 median at $2.8 million, down 14.3 percent. A fourth site, Houzeo, lands at $2,837,500 and calls it flat.
Four sources. Four numbers. All labeled "Menlo Park." All current. None of them wrong.
If you're trying to figure out what a home actually costs in this city right now, that spread is more than an annoyance. It's the first real signal that Menlo Park stopped being one market some time ago, and started being at least three.
Each tracker is measuring something slightly different, and the differences aren't cosmetic.
| Tracker | What it measures | Window | Median | Year-over-year |
|---|---|---|---|---|
| Redfin | Closed sales, all housing types | 3 months ending June 2026 | $3.3 million | up 14.5% |
| Zillow (ZHVI) | Blended estimated value index | as of late June 2026 | $2,549,093 | down 6.7% |
| PropertyShark | Closed sales, single-family houses only | Q1 2026 | $2.8 million | down 14.3% |
| Houzeo | Closed sales | February 2026 | $2,837,500 | flat |
Redfin's figure is a closed-sale median across everything that traded, houses and condos together. Zillow's ZHVI is a modeled index that smooths across the entire housing stock, which softens it when a wider mix of older or smaller homes changes hands. PropertyShark isolates single-family houses from condos, and in the same quarter it showed those two categories moving in opposite directions: house prices down 14.3 percent while condo prices rose 27.3 percent. Blend those two together and you get something that looks stable. Separate them and you get a story of luxury houses cooling while entry-level condos heat up.
None of the four sites is lying to you. They're each answering a slightly different question, and Menlo Park in 2026 is exactly the kind of market where that difference actually moves the number by hundreds of thousands of dollars.
Here's the detail that made me stop scrolling. Redfin's own price-per-square-foot figure for the three months ending June 2026 fell 22.2 percent year over year, even as the median sale price rose 14.5 percent over the identical window.
Read those two numbers side by side and they seem to contradict each other. They don't. What they describe is a market where larger homes are making up a bigger share of what's selling, pulling the median price up in dollar terms while the value per square foot compresses. That's not appreciation. That's a change in what's being sold. A city can post a headline-grabbing median gain in the same quarter that its actual value per foot is falling, and both statements can be true at once.
This is the mechanism behind every one of those four conflicting numbers. Menlo Park's median isn't drifting up or down because homes are worth more or less. It's swinging because the mix of what closes escrow each month, big house or small condo, west side or east side, changes which sub-market dominates the sample.
Redfin's neighborhood-level data tells a sharper version of the same story. Over the three months ending May 2026, the West Menlo Park sub-market posted a median sale price of $4.2 million, up 31.7 percent year over year. The citywide median over that identical window rose 8.6 percent to $3.3 million. West Menlo's median sale price is rising at close to four times the pace of the city it belongs to, and the dollar gap between that pocket and the citywide figure widened by roughly half a million dollars in twelve months.
That's not two ends of a bell curve stretching slightly further apart. That's one sub-market pulling away from its own city's average fast enough to distort the average by itself.
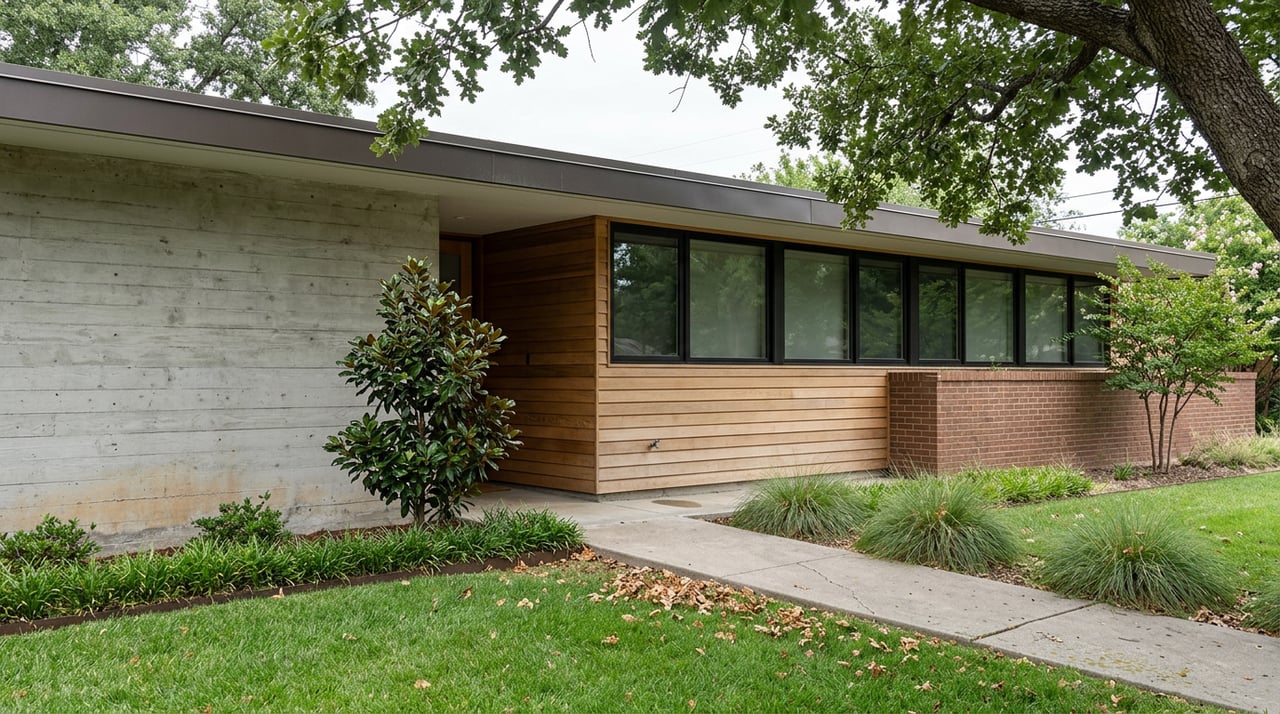
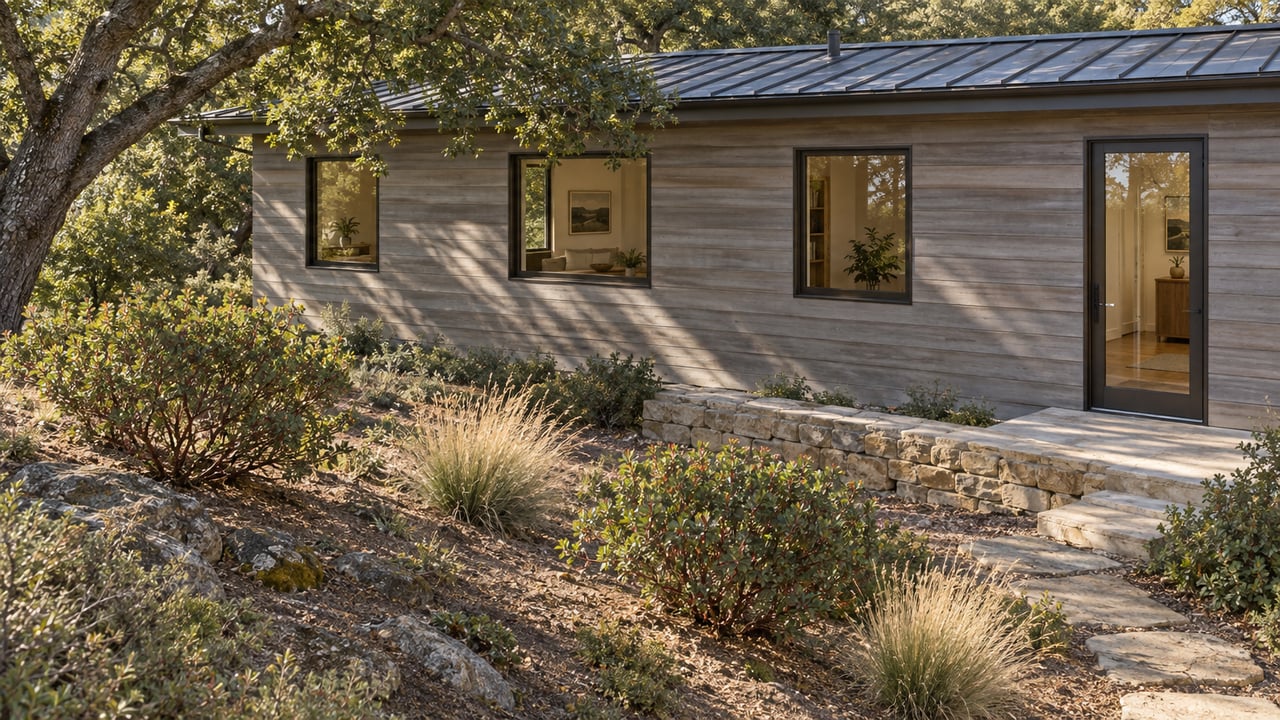
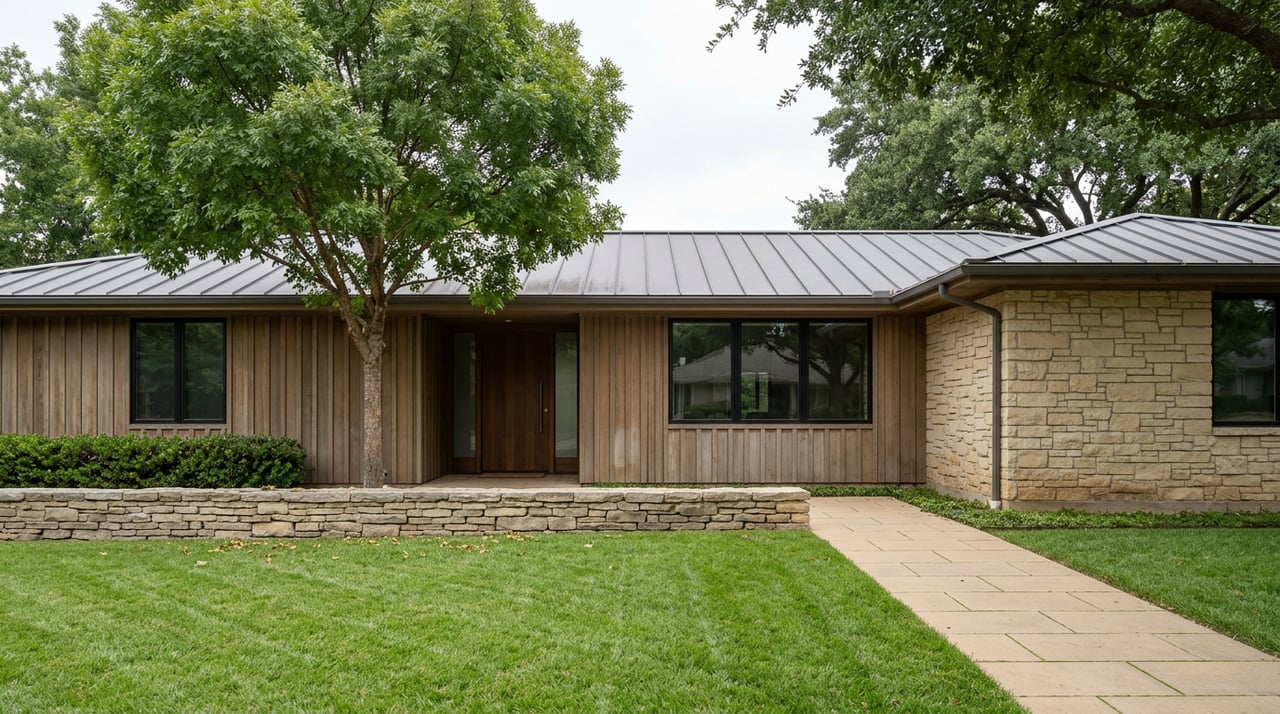
West Menlo Park, the area west of Alameda de las Pulgas bordering Sharon Heights and the Stanford foothills, is dominated by ranch-style homes on lots typically running 7,000 to 12,000 square feet, many of them recently rebuilt or extensively remodeled. It falls in the Las Lomitas Elementary School District, a boundary line that shows up repeatedly in local pricing data as a factor buyers weigh when comparing otherwise similar homes on either side of it.
East of El Camino Real, the pattern flips. Smaller lots, more mid-century ranch and bungalow stock, and a faster pace of turnover. The Willows, a neighborhood of tree-lined streets roughly bounded by Willow Road, Santa Cruz Avenue, and University Drive, sits in what one Peninsula analyst called the city's Goldilocks zone: not as expensive as Central Menlo, not as remote as West Menlo. Homes there sit on 6,000- to 8,000-square-foot lots and trade between $2.5 million and $3.5 million. Perennially popular streets include Oakdell Drive, Felton Drive, and Avy Avenue. A representative sale: a three-bedroom, two-bath 1970s ranch of roughly 2,400 square feet closed for $2.68 million in March 2026 after twelve days on market.
Linfield Oaks, an 80-acre planned community built in the 1950s adjacent to Burgess Park, offers curving streets and single-story ranch homes and feeds the Menlo Park City School District. Sharon Heights, anchored by the Sharon Heights Golf and Country Club, moves more slowly than the rest of the city, with a median around 21 days on market.
Each of these is a real, distinct market with its own pace and price ceiling. The citywide median erases every one of those distinctions the moment you average them together.
This kind of geographic fracture isn't unique to Menlo Park. A guest analysis published by The Almanac in May 2026 laid out a similar pattern one town over. In the first quarter of 2026, single-family closings in Atherton fell roughly 52 percent year over year on just 32 new listings, yet the median sale price there held near $7.4 million, with five sales closing above $15 million. Menlo Park moved in the opposite direction over the same quarter: closings rose about 50 percent, new listings climbed nearly 39 percent, and the median slipped only about 2 percent.
The analysis attributed Atherton's thinning, high-median pattern to a growing share of its top-end inventory closing privately between agents before reaching the public market, while more typical family-sized Menlo Park homes kept trading in the open. The takeaway for a Menlo Park buyer isn't about Atherton directly. It's a reminder that on this stretch of the Peninsula, a headline median can hold steady or even fall while the underlying market beneath it is doing something far more specific, and that the only way to see the real pattern is to look at what's actually closing, street by street, rather than at the blended number on top.
Separately, on Menlo Park's east side, Meta halted its Willow Village office and housing development in the Belle Haven area earlier in 2026, a project the city had been counting toward its state-mandated housing goals.
If you're comparing Menlo Park to another Peninsula city using a single portal's median, you're comparing an average of at least three markets moving at different speeds to a number that may or may not have that same problem. The fix isn't to find the "correct" website. It's to stop shopping the citywide figure and start asking which of Menlo Park's sub-markets actually matches what you want: the ranch-house scale and walkability of The Willows, the acreage and school boundary of West Menlo, the club-anchored pace of Sharon Heights, or the planned-community consistency of Linfield Oaks. The price band attached to each of those answers is a real number. The citywide median is not.
Which single number should I trust? None of them in isolation. Each tracker is accurate for what it measures. Ask what's being counted, houses only or houses and condos, blended index or closed-sale median, before you compare it to another city.
Is West Menlo Park now pricing like Atherton? Not yet, but the gap is closing faster than the citywide numbers suggest. A 31.7 percent rise in one sub-market against an 8.6 percent citywide rise over the same three-month window is the kind of divergence worth watching closely if that's the neighborhood you're targeting.
Does the school district boundary really affect price? Local pricing data consistently shows the Las Lomitas and Menlo Park City School District attendance lines correlating with price-per-foot differences between otherwise comparable homes. It's one factor among several, including lot size and proximity to downtown, not a standalone predictor.
If you want the real comparison for your specific search, one that separates the sub-market you actually want from the citywide blend, Vicki Ferrando can pull it together. Request Your Complimentary Market Valuation and get numbers built for the neighborhood you're shopping, not the one an algorithm averaged around it.
Stay up to date on the latest real estate trends.
Vicki is consistently the main point of contact throughout the real estate transaction and maintains a streamlined avenue of communication with clients. She curates a highly respected network of resources for connecting clients with local specialists and service vendors. Contact her today!
GET IN TOUCH WITH VICKI TO LEARN MORE
VICKI FERRANDO | CA DRE# 01418802
160 MAIN ST LOS ALTOS CA 94022